UK Programmatic Advertising Forecast for 2016-2019: The Industry Gets Serious About Fraud and Brand Safety
December 20, 2017
UK Programmatic Advertising Forecast for 2016-2019: The Industry Gets Serious About Fraud and Brand Safety
Executive Summary
The UK market for programmatic digital display ad spending continues to be strong, despite concerns about brand safety and other issues that made it into mainstream media this year. There are still kinks to iron out, but transparency is improving and will get even better as various technological plays come into effect.
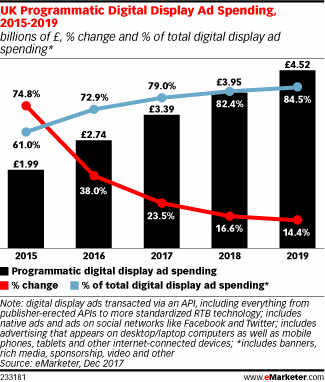
- Programmatic digital display ad spending continues to rise at a healthy clip. From £1.99 billion ($2.69 billion) in 2015, programmatic will account for £3.39 billion ($4.58 billion) in 2017 and £4.52 billion ($6.10 billion) by 2019.
- The predominance of social media display spending has skewed the market toward programmatic direct—the majority of social display is bought this way. Real-time bidding (RTB), which includes both open market and private marketplace spending, is expected to account for 45.5% of the programmatic total for 2017, while direct will take up 54.5%.
- Mobile continues to be a major growth driver of programmatic, while 2017 was projected to be the first year where desktop display saw a decline in programmatic spend. Mobile spend will reach £2.64 billion ($3.56 billion) and account for 78.0% of the total market.
- Video continues to grow, but quality inventory is limited, so that much of what is available is low quality and often open to fraud.
- In response to programmatic being in the spotlight like never before (often for the wrong reasons), the industry has begun to step up its game even more with regard to transparency. Initiatives like ads.txt are a step in the right direction toward making the programmatic supply chain easier to manage and scrutinize.
“Growth in programmatic digital display ad spending is strong at £3.39 billion ($4.58 billion). This represents 79.0% of all UK digital display ad spending, and that share will reach 84.5% by 2019.”
Table of Contents
- UK Programmatic Advertising: eMarketer’s Estimates and Forecast
- Behind the Numbers: Growing Pains Persist
- Future Trends: Tech Will Help Build More Trust and Transparency

See original eMarketer report, here.
List of Charts
UK Programmatic Digital Display Ad Spending, 2015-2019 (billions of £, % change and % of total digital display ad spending*)
UK Programmatic Digital Display Ad Spending, 2015-2019 (billions of £, % change and % of total digital display ad spending*)
UK Programmatic Digital Display Ad Spending, by Transaction Method, 2015-2019 (billions of £, % change and % of total programmatic digital display ad spending)
UK Real-Time Bidding (RTB) Digital Display Ad Spending, by Segment, 2015-2019 (millions of £, % change and % of total RTB digital display ad spending)
UK Programmatic Digital Display Ad Spending, by Device, 2015-2019 (millions of £, % change and % of total)
UK Mobile Programmatic Display Ad Spending, 2015-2019 (billions of £, % change and % of total mobile display ad spending)
UK Mobile Programmatic Digital Display Ad Spending, Programmatic Direct* vs. Real-Time Bidding (RTB)**, 2015-2019 (millions of £, % change and % of total)
UK Real-Time Bidding (RTB) Mobile Display Ad Spending, by Segment, 2015-2019 (millions of £, % change and % of total)
UK Programmatic Digital Video Ad Spending, 2015-2019 (millions of £, % change and % of total digital video ad spending)
UK Programmatic Digital Display Ad Spending, by Format, 2015-2019 (millions of £, % change and % of total)
UK Programmatic Digital Video Ad Spending, by Device, 2015-2019 (millions of £, % change and % of total programmatic digital video ad spending)
UK Mobile Programmatic Display Ad Spending, by Format, 2015-2019 (millions of £, % change and % of total)
Percent of Digital Ad Budget Spent on Programmatic Advertising According to Marketing Professionals in Europe and the US, 2013-2016 (% of respondents)
UK Digital Display Ad Spending Share, by Format and Purchase Method, 2016 (% of total)
UK Digital Display Ad Spending Share, by Format, H1 2017 (millions of £ and % of total)
Aspect of Media that UK* Senior Marketers Would Most Like to Change, April 2017 (% of respondents)
Challenges of Programmatic Advertising According to Brand Advertisers Worldwide, Aug 2017 (% of respondents)
